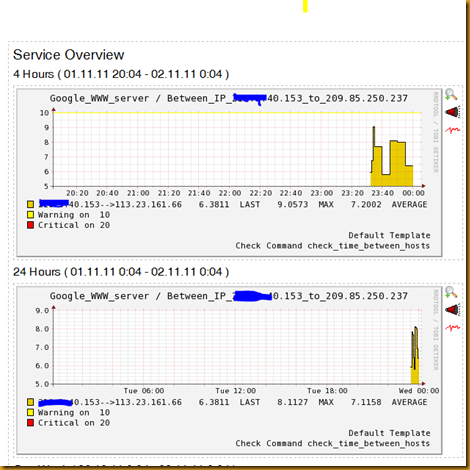
We had to create a plugin to basically do the following
1) Do a typical traceroute from the Nagios box to a destination IP
2) Instead of calculating the time between the Nagios to Destination Host, we are interested to know the time between two host in between
In other words, a typical traceroute will
NagionServer –> Gateway –> Hop 1 –> Hop 2 –> Hop 3 –> Destination
What this plugin can do is when defined correctly, to check the time (in ms) between Hop 1 up until Hop 3, plot a graph and put up warning and critical values for your alerting.
Here’s the sample plugin, and relevant configuration files you probably need.
NOTE: You may need to tweak for different Oses other than Debian as this was created and tested with a Debian.
The plugin
- The plugin (place typically in /usr/local/nagios/libexec)
- Paste below into a file say trace_time
- Make sure it belongs to user <nagios> and has execution right; e.g.
- chown nagios:nagios /usr/local/nagios/libexec/trace_time
- chmod +X /usr/local/nagios/libexec/trace_time
| #####START PLUGIN##### #!/bin/bash # # usage # ./trace-time <final-dest> <startip> <endip> <warning> <critical> # Note: You must define all three, there’s no error checking # tip: do a traceroute first, then determine from which ip to which ip do you want to calculate. If # # DEST=$1 IP1=$2 IP2=$3 WARNING=$4 CRITICAL=$5 PROG=`which traceroute` if [[ $DEST == “” ]]; then echo “UNKNOWN: No destination ip defined” exit 3 fi if [[ $IP1 == “” ]]; then if [[ $IP2 == “” ]]; then if [[ $WARNING > $CRITICAL ]]; then |
Nagios – Host.cfg
| define host{ use debian5-linuxserver host_name Google WWW server alias For Tracing TimeHop Distances address 209.85.175.105 } |
Nagios – commands.cfg
| define command{ command_name check_time_between_hosts command_line $USER1$/trace-time $HOSTADDRESS$ $ARG1$ $ARG2$ $ARG3$ $ARG4$ } |
Nagios – services.cfg
| define service{ use debian5-linuxservice host_name Google WWW server service_description Between IP 210.5.40.153 to 209.85.250.237 action_url /nagios/pnp/index.php?host=$HOSTNAME$&srv=$SERVICEDESC$ check_command check_time_between_hosts!210.5.40.153!113.23.161.66!10!20 } |
- Note, the template debian5-linuxservice and debian5-linuxserver is not default and you need to define one first or use the defaults
Now, just restart Nagios to make it work.More info
In order for you to know the hop you wish to monitor, simply do a traceroute;
traceroute -n -q 1 209.85.175.105
-n = Numeric output
– q 1= Only do a single query
In this example below, I am tracing to one of Google’s servers at 209.85.175.105, the output of the trace is like below (NOTE!: actual IPs have been changed)
1 111.22.42.3 0.554 ms
2 111.22.40.153 0.667 ms
3 111.22.40.125 1.026 ms
4 203.188.233.121 1.218 ms
5 203.188.233.205 1.488 ms
6 113.23.161.66 1.627 ms
7 209.85.242.246 1.542 ms
8 209.85.242.125 2.322 ms
9 66.249.94.158 3.075 ms
10 209.85.175.105 2.801 ms
So lets say you wish to trace the time between IP 111.22.40.153 and IP113.23.161.66, simply use the plugin with these values on the CLI (to test);
./trace-time 209.85.175.105 111.2.40.153 113.23.161.66 10 20
And the output will look like this;
OK(5.909): Time OK|’111.22.40.153–>113.23.161.66’=5.909;10;20;;
*Which is a typical output expected by Nagios with PNP graphing enabled
Graphs will look like this


Sanjay, nice job. I did some testing to see if I could adapt the code for my need of testing a MPLS connection between offices. I was thinking of using it to test the Primary (ideal) connection. We discovered that you are not testing if the IPs are actually in the traceroute results. Lets say the second hop IP drops off the network. You are still giving a time result. I think you need to test if numberip1 and numberip2 are in the traceroute results. The answer is blank when they are missing. This should make your plugin more reliable.